Yurii Danyltsiv
Data Analyst Portfolio
About Me
Data Analyst with a background in business management.
I use SQL, Python, and Tableau to analyze data, build dashboards, and generate actionable business insights for decision-making.
Projects
Small Business Financial Analysis
This project analyzes financial data of a small business to identify revenue trends, cost drivers, and opportunities for optimization.
This solution can be adapted to analyze financial data for different types of small businesses using custom datasets, making it applicable to real-world scenarios.
End-to-end workflow: data generation, SQL analysis, and dashboard development.
Tools: Python (Pandas), SQL (PostgreSQL), Tableau
Used SQL for KPI calculation, time-series aggregation, and Pareto analysis using window functions.
Key Insights
- Top expense categories account for ~60–80% of total costs (Pareto principle)
- Salary and Marketing are the main cost drivers
- Profitability shows variation throughout the year, with potential seasonal patterns
- Business is highly dependent on a single revenue stream (~80% Sales)
Business Value
- Identified opportunities to optimize marketing expenses
- Highlighted risks related to revenue concentration
- Provided actionable insights for cost control and growth
Visualizations
Dashboard Overview
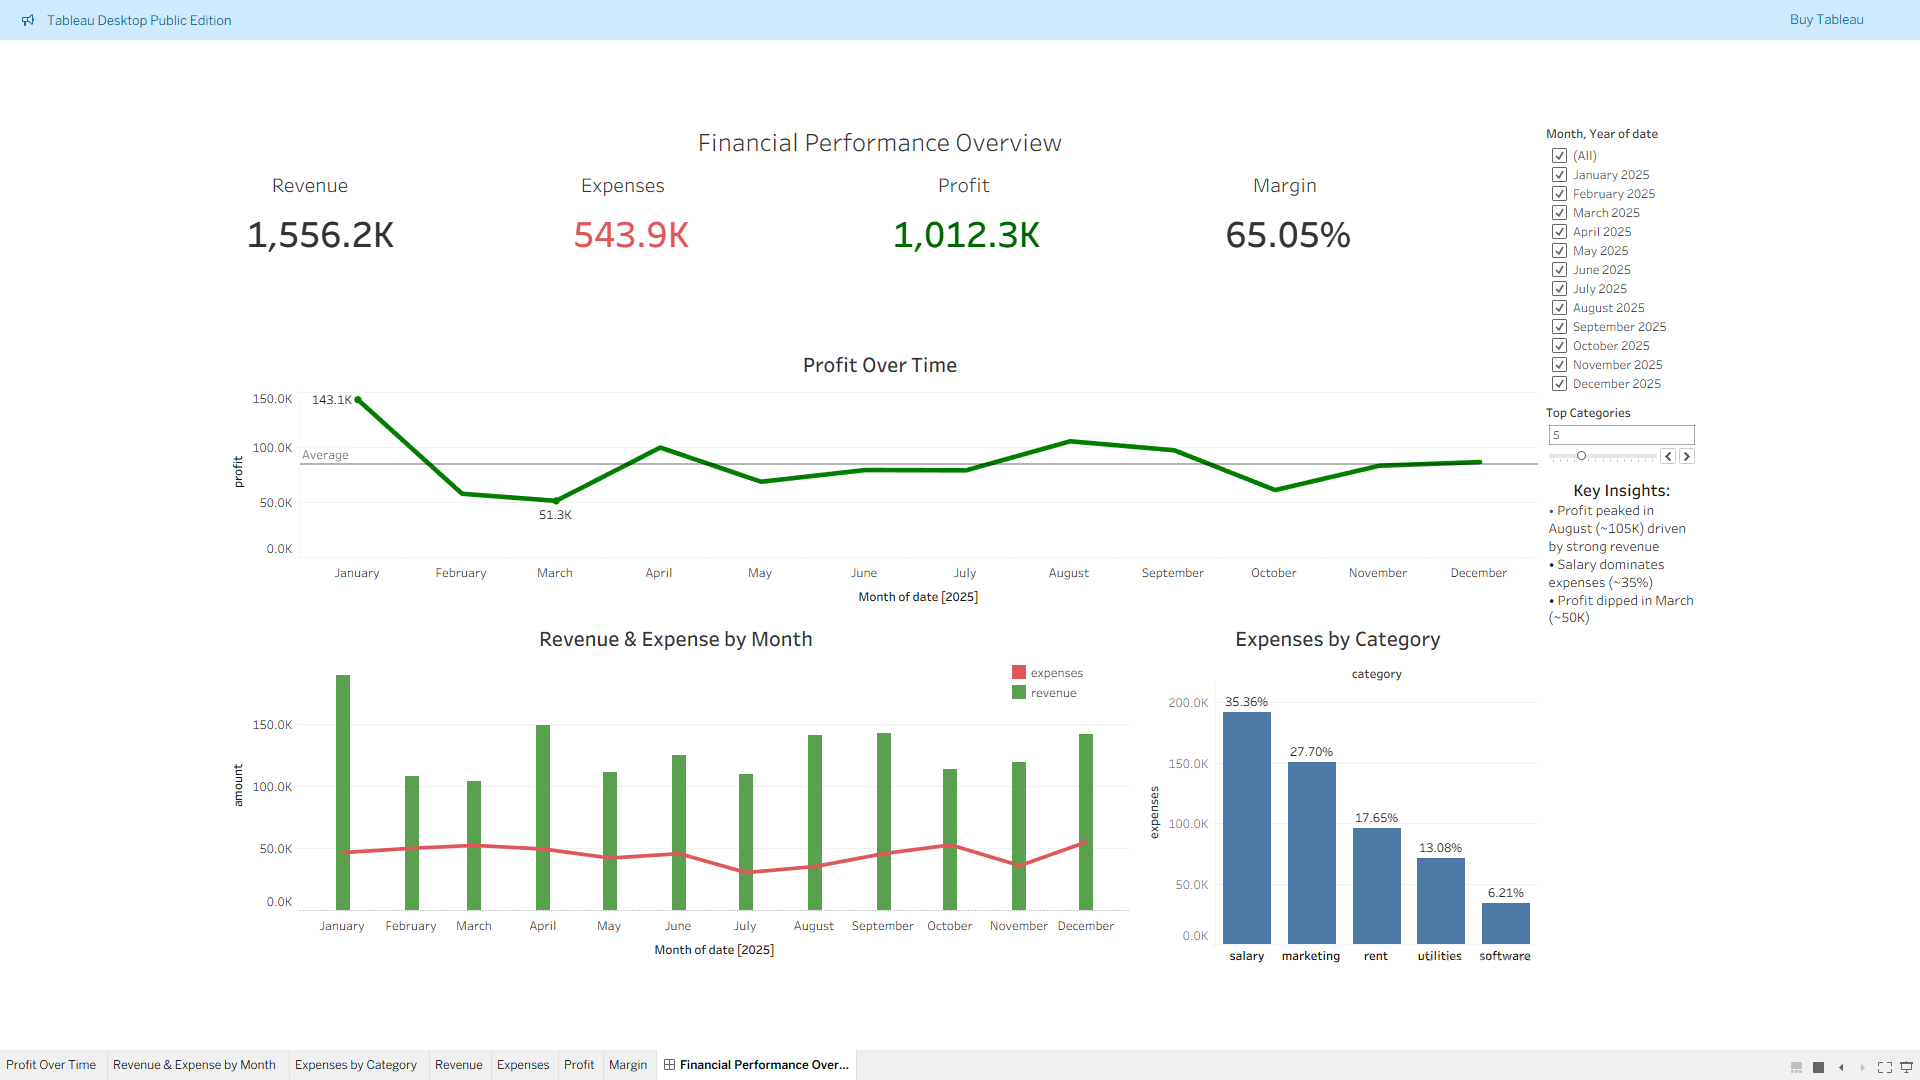
Key Visualizations
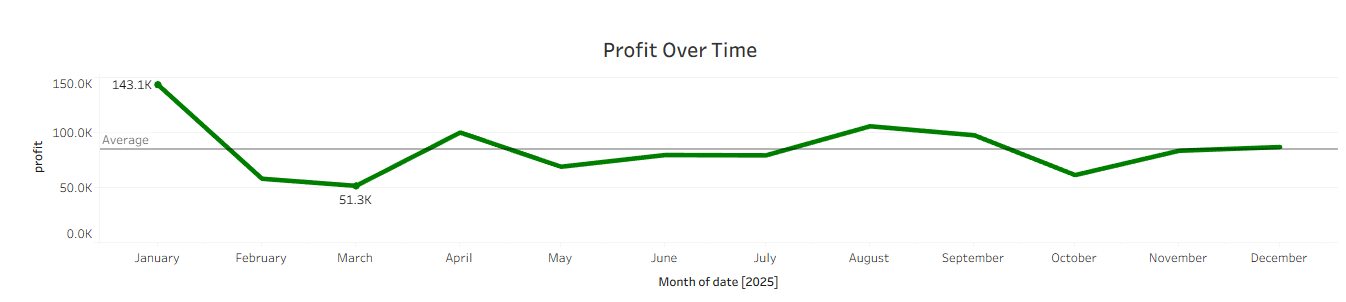
Profit over time shows variation with potential seasonal patterns.
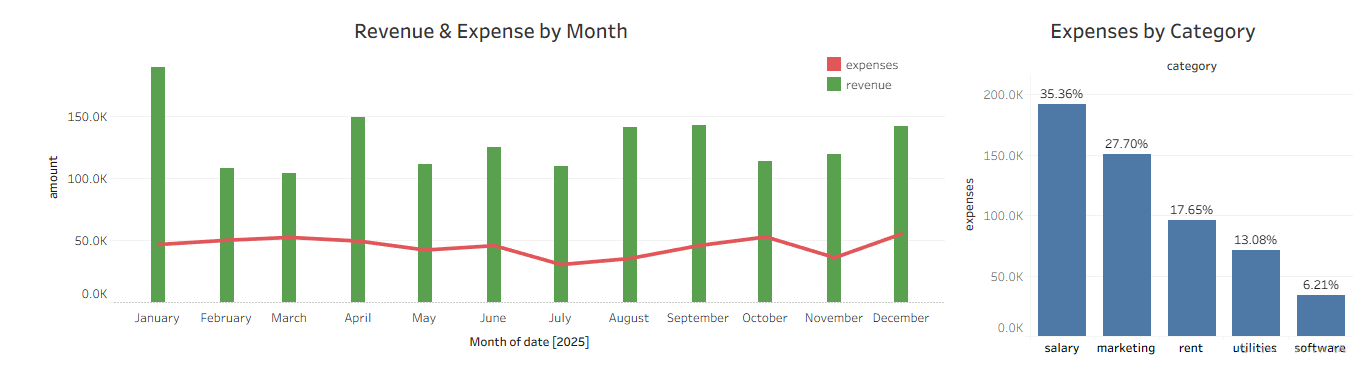 Analysis of revenue and expenses highlights key cost drivers and their distribution across categories and time.
Links
View Full Project, Code & SQL Analysis on GitHub
A/B Test Analysis for Guest Checkout Optimization
This project simulates and analyzes an A/B test for checkout flow optimization in an e-commerce environment.
The experiment evaluates whether a simplified guest checkout process can improve conversion rate and revenue metrics by reducing friction during purchase completion.
Tools: Python, Pandas, Tableau, Statistical Testing
Performed exploratory data analysis (EDA), conversion rate analysis using z-test, ARPU analysis using Welch’s t-test, and confidence interval estimation for conversion uplift.
Key Insights
- Simplified checkout flow showed higher conversion rate and ARPU values
- Experimental group conversion rate increased from 4.99% to 5.61%
- Results were directionally positive but not statistically significant at α = 0.05
- Confidence interval analysis suggested a potentially positive effect, but additional data collection is required
Business Recommendation
- Continue the experiment to increase statistical power and validate the observed trend
- Use larger sample sizes before making product-level decisions
Visualization
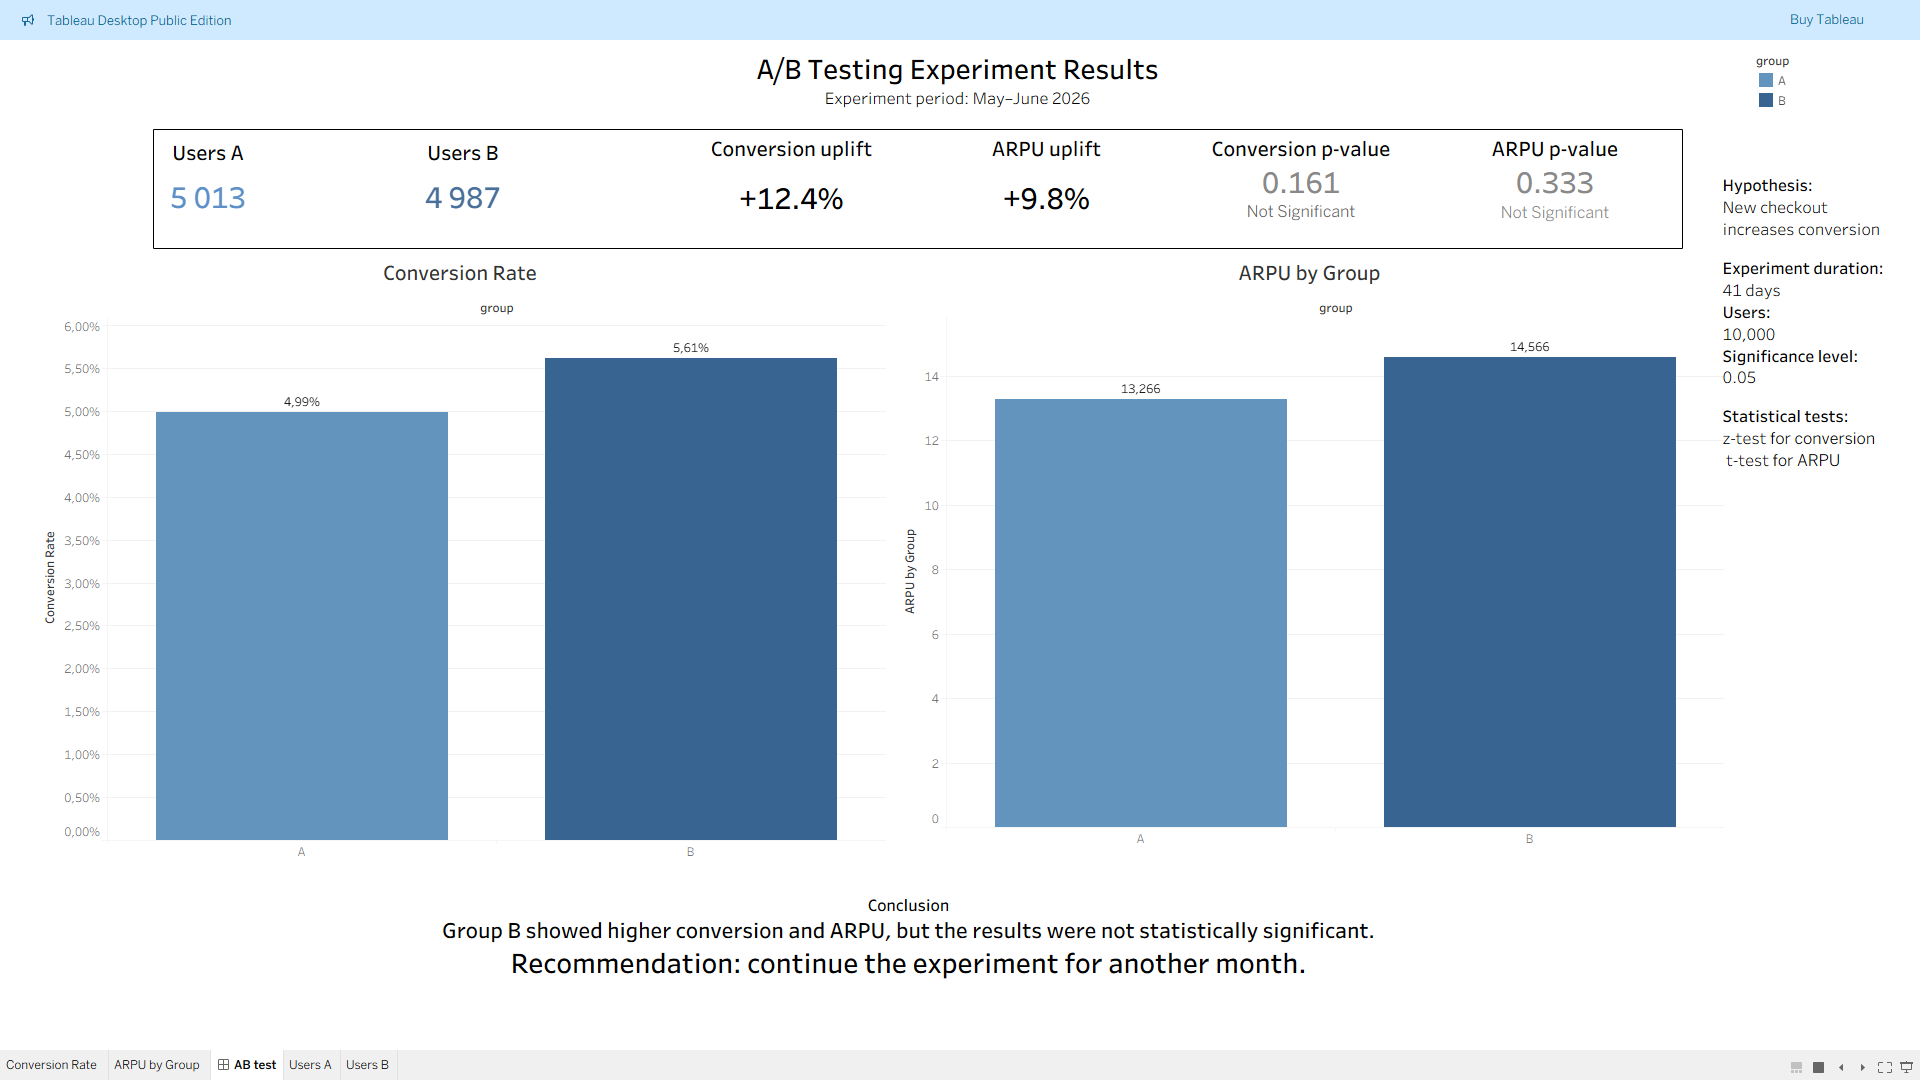
Dashboard visualizes conversion performance, revenue metrics, and statistical comparison between experimental groups.
Links
View Full Project & Code on GitHub
Contact
GitHub: https://github.com/Yurii-Dan
Email: yuriidaniltsiv@gmail.com